

10k Words | April 2023
10k Words | April 2023
Apparently, Confucius did not say “One Picture is Worth Ten Thousand Words” after all. It was an advertisement in a 1920s trade journal for the use of images in ads on the sides of streetcars...
Funds continue to flow into equities despite recent volatility and recession fears, with Barclays noting fund flows lag performance. Performance is highly correlated with money supply, notes GLJ Research, and central bank liquidity may actually have been increasing lately according to Citi Research. The “Buy the Dip” mantra helps, as Bloomberg charts this strategy’s recent success. Despite equity markets holding up, capital raising remains suppressed relative to dealogic’s 2020 and 2021 figures. WSJ highlighted aerospace and defence technology as an area where there does appear to be strong capital flows. US banks, however, have seen deposit outflows, as charted here by Reuters. Margins have blown out on ASX-listed debt and hybrids, as per Bell Potter charts, which are largely issued by banks and financials. Bond market volatility is at historically high levels as seen from Bespoke and FT charts. Back in equities, the concentration of major indices stands out and Equitable Investors has pulled together top ten stats. The S&P 500 would have been down in March without “big tech”, eToro highlights.
US households supporting flows to equities despite recession risk

Source: Barclays Research
Money Supply (M2) has high correlation with S&P 500
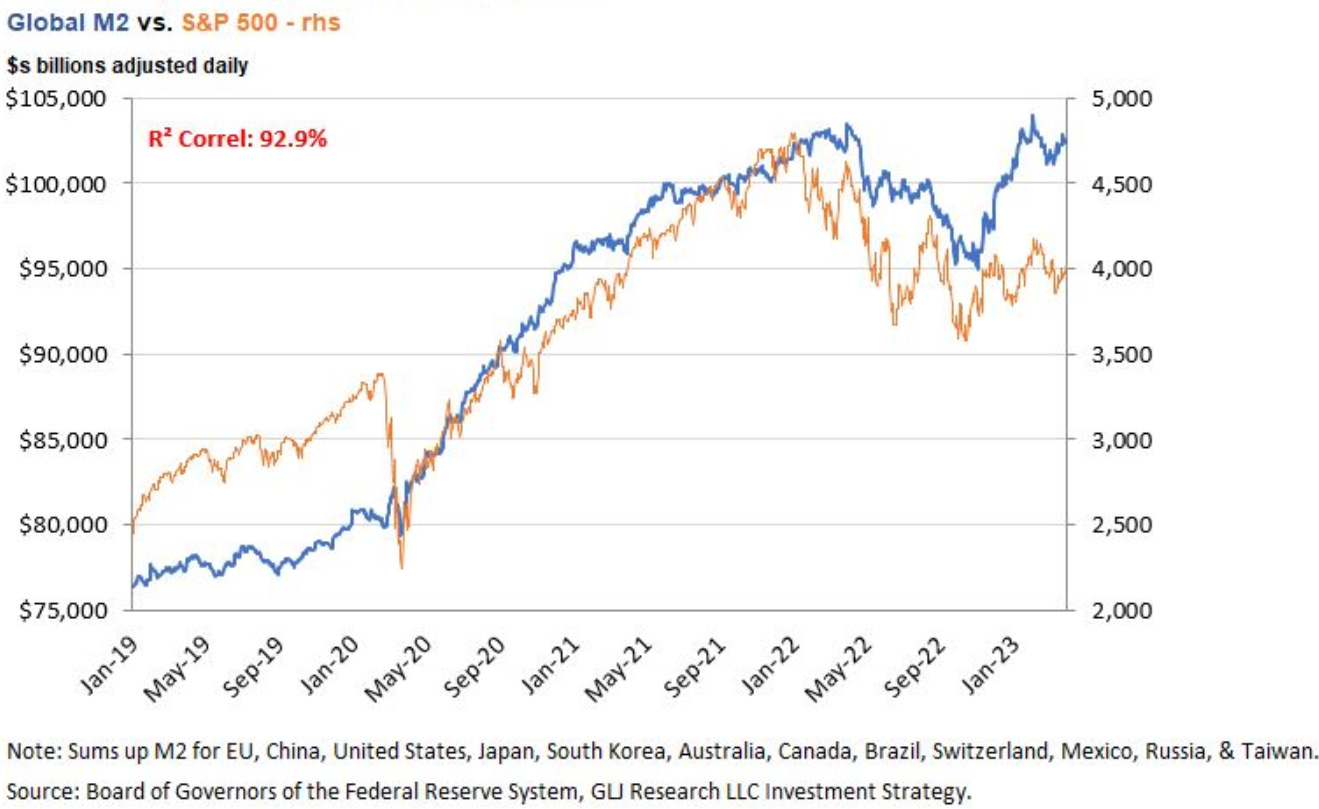
Source: GLJ Research
Global central bank liquidity has been increasing according to Citi Research
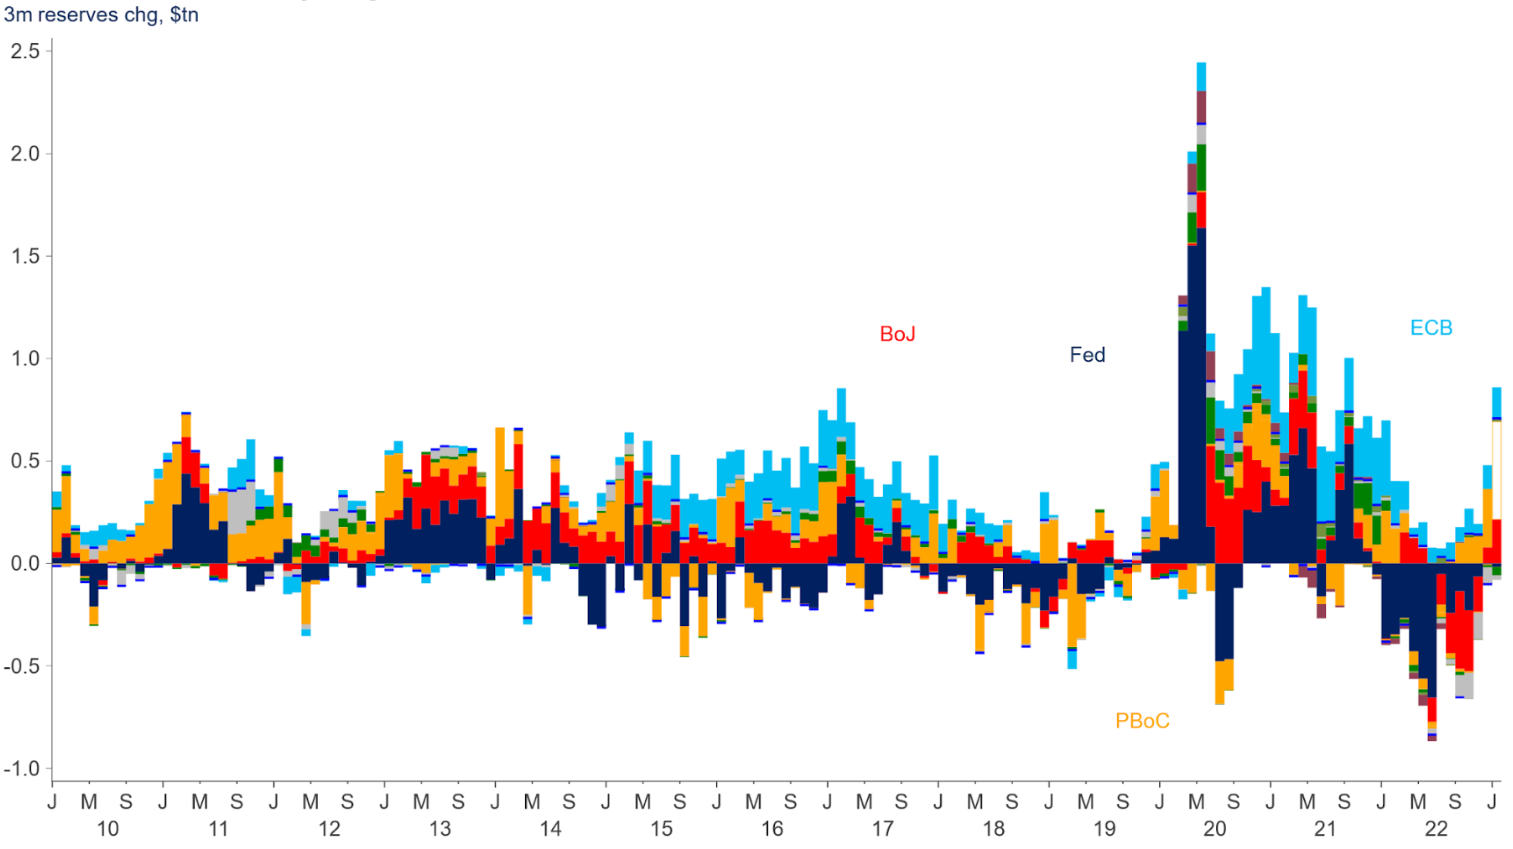
Source: Citi Research, Bloomberg
2023 shaping up as the second best year for dip-buying strategy
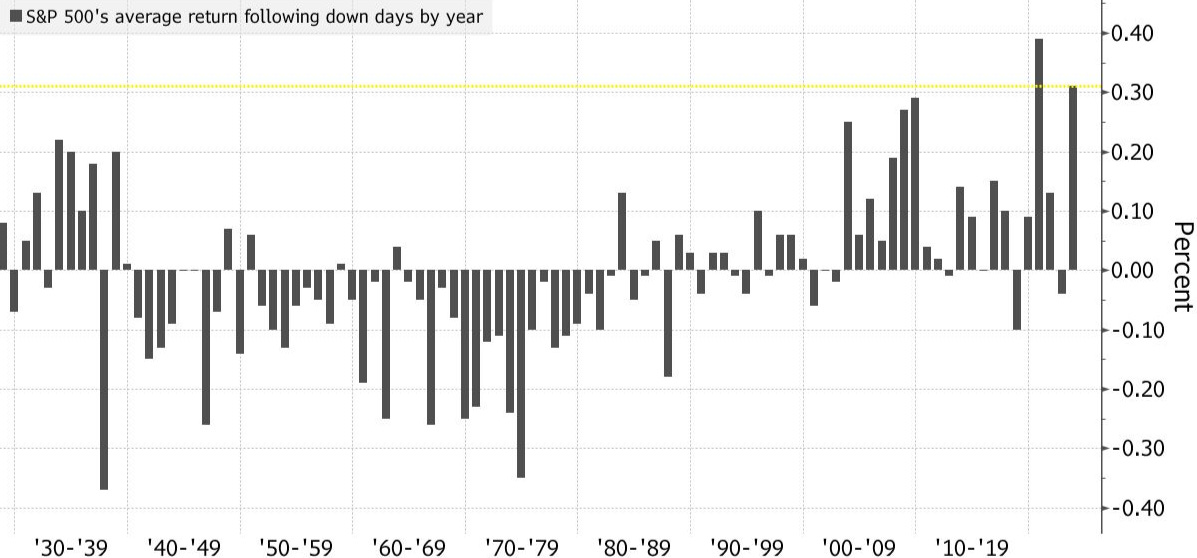
Source: Bloomberg
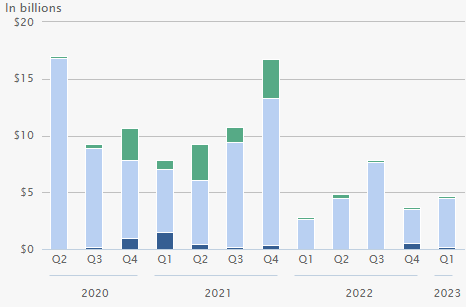
Global equity capital raisings by quarter ($US)
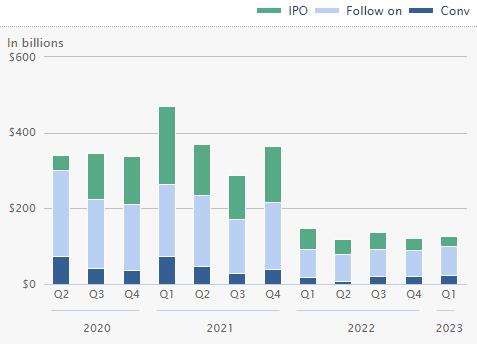
Source: WSJ, dealogic
Australasia equity capital raisings by quarter ($US)
Source: WSJ, dealogic
US VC deal activity in aerospace and defence technology
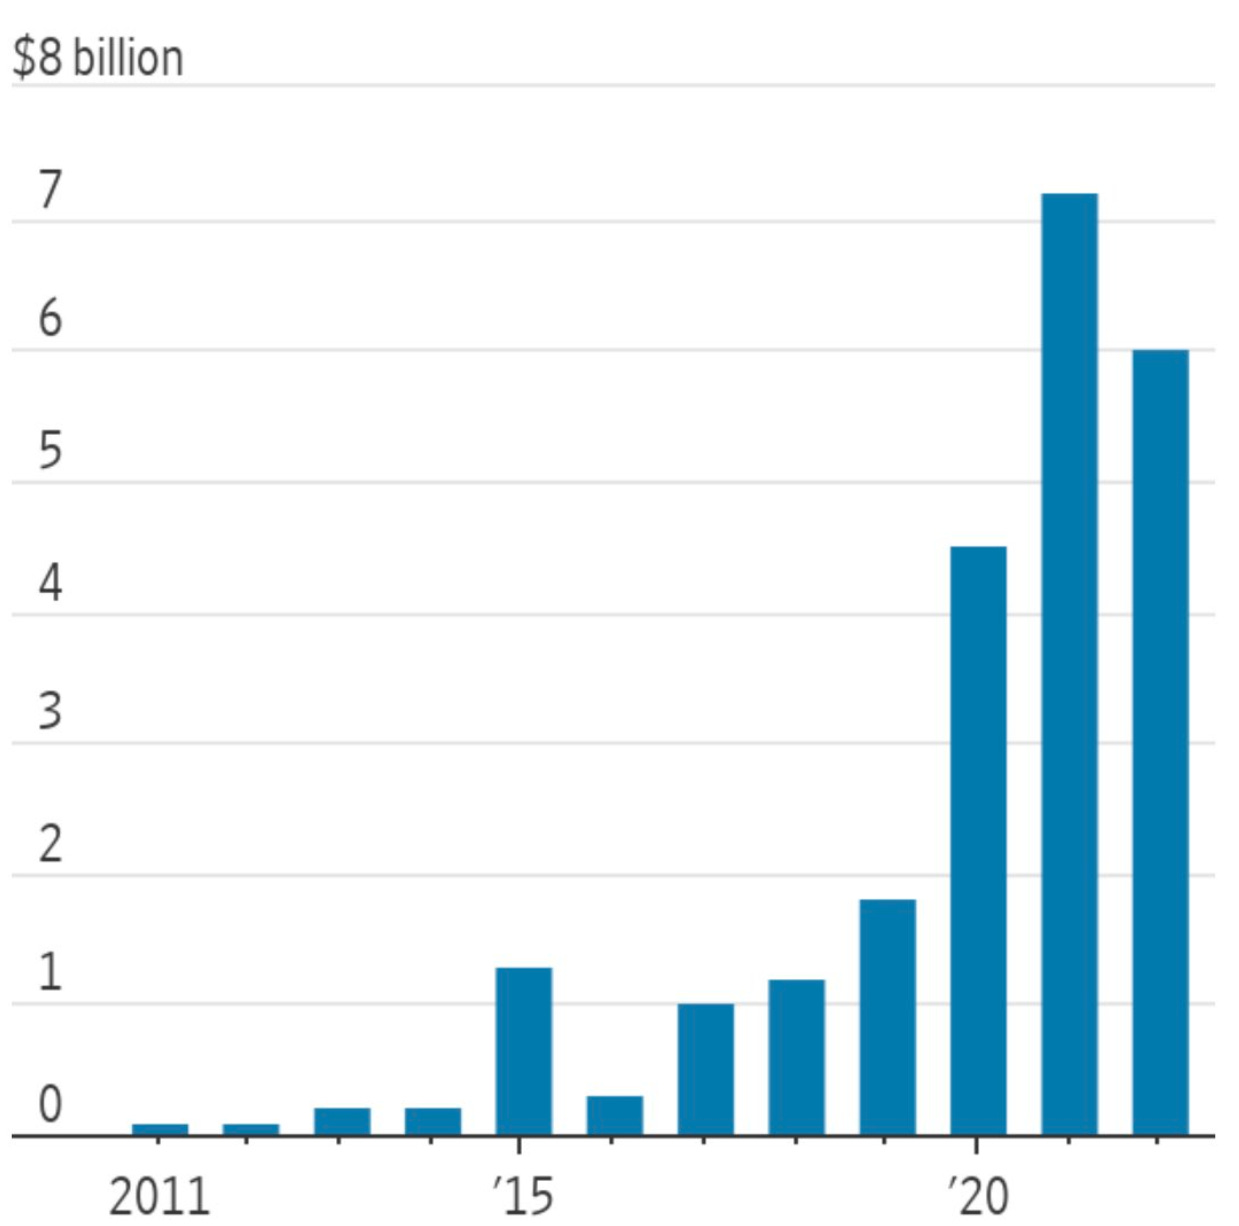
Source: WSJ, PitchBook
US bank deposits
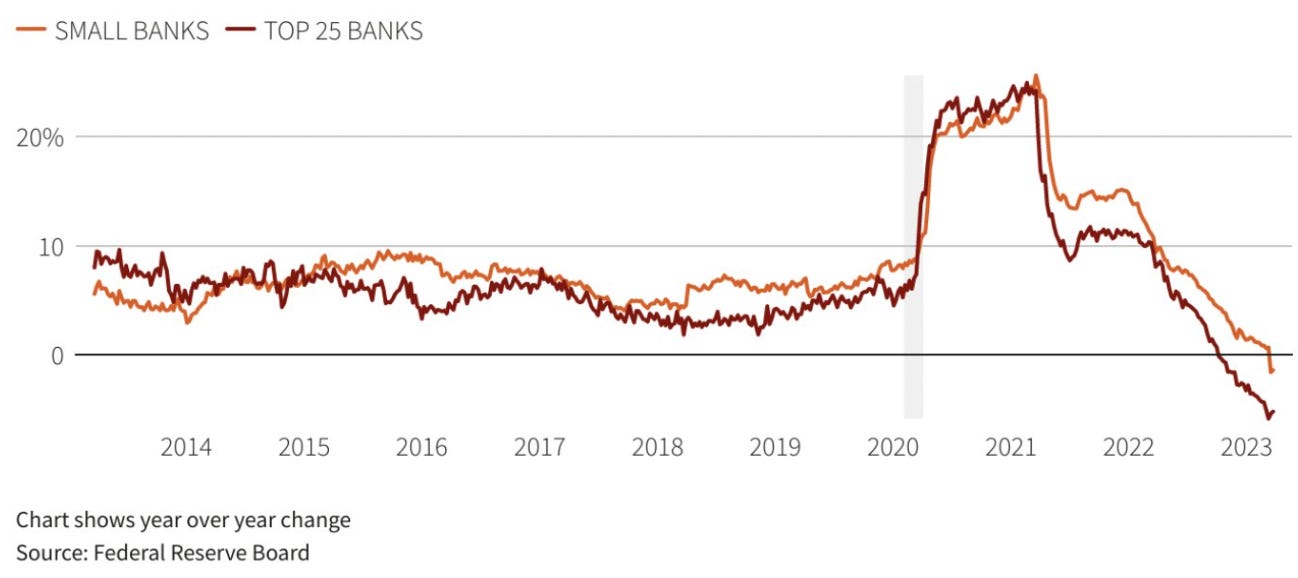
Source: Reuters
Trading Margins on ASX Listed Debt and Hybrid Sectors (27 Mar)
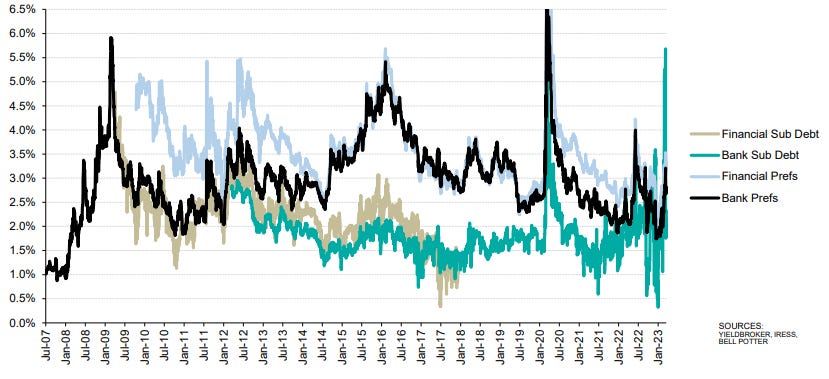
Source: Bell Potter Research
US Two-Year Bond Yield - Four Week Average Daily Move
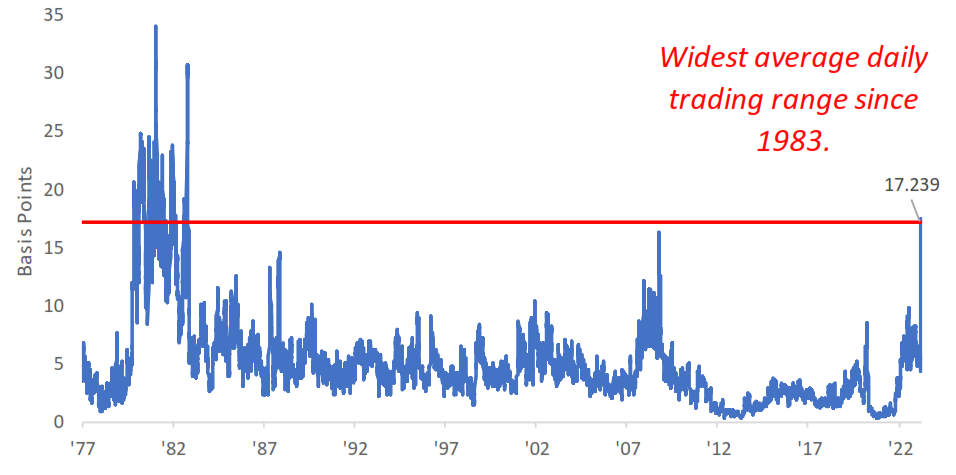
Source: Bespoke Investment Group
ICE BofAML MOVE Index (US bond market implied volatility)
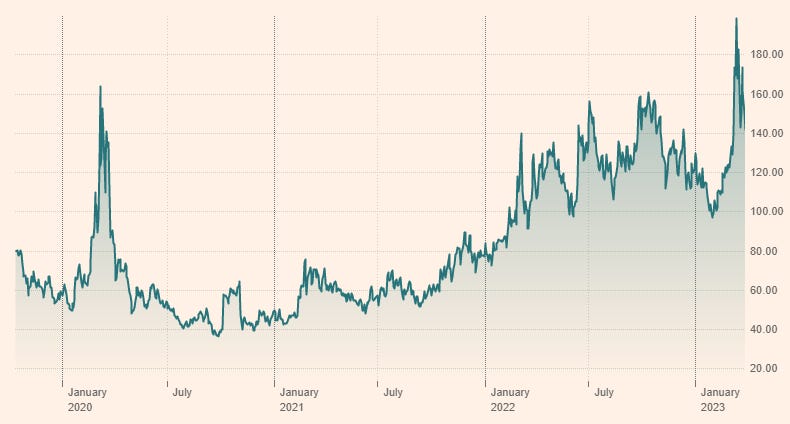
Source: FT, Refinitiv
Top 10 Nasdaq 100 components = 55% weighting
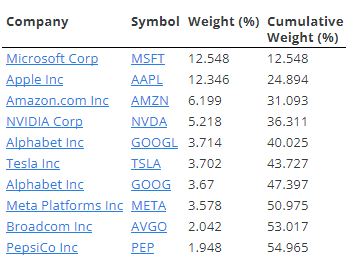
Source: Equitable Investors, SlickCharts
Top 10 S&P 500 components = 27% weighting
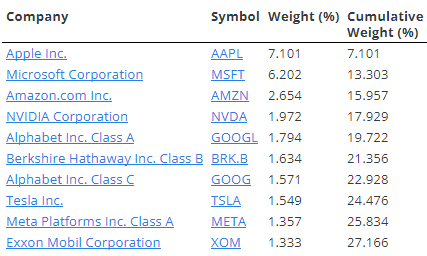
Source: Equitable Investors, SlickCharts
Top 10 iShares Core S&P/ASX 200 ETF components = 46% weighting
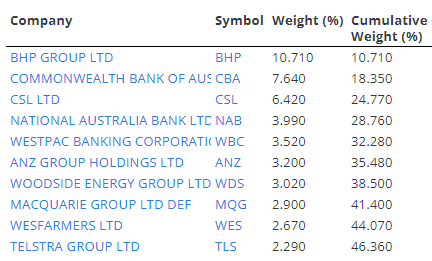
Source: Equitable Investors, Iress
S&P 500 performance without “big tech”
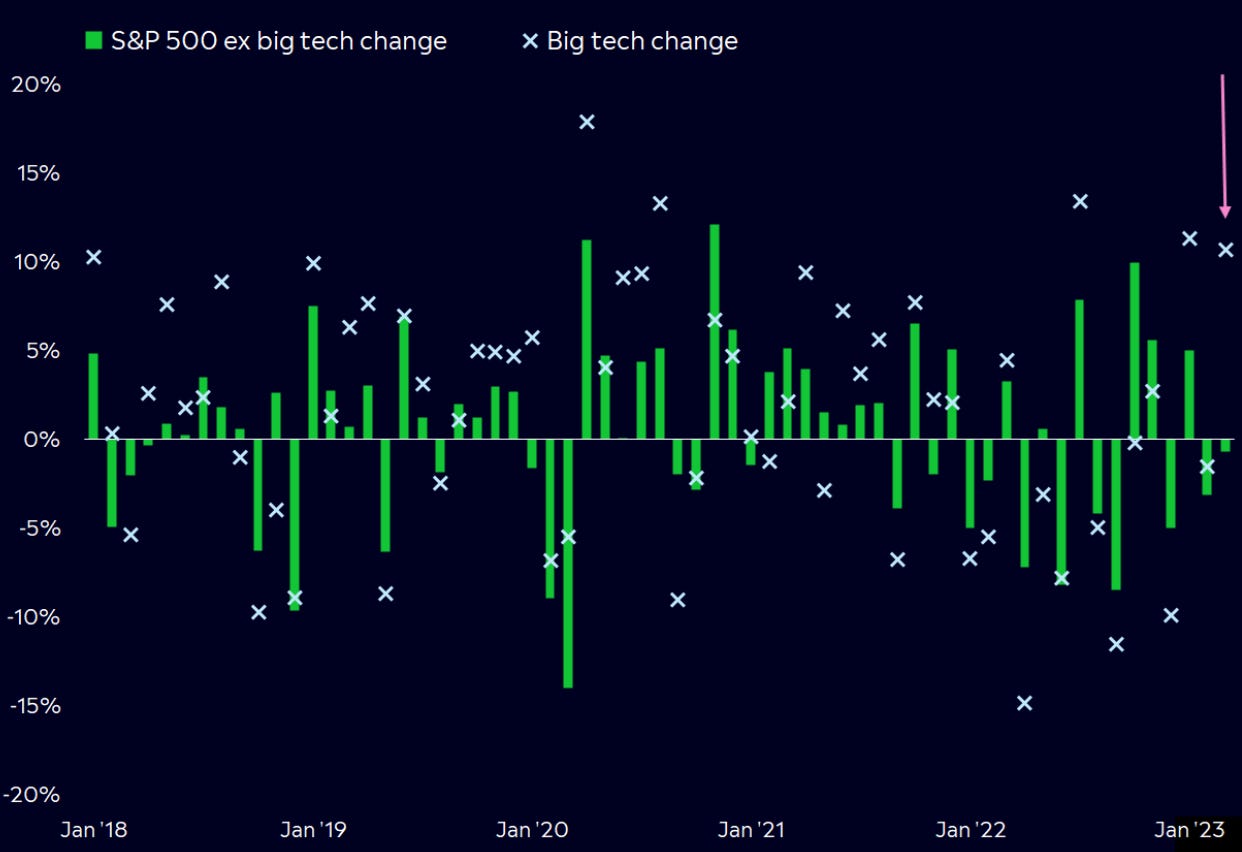
Source: eToro, Bloomberg